The value of diversifying with small caps
Small companies make up 90% of the US market and account for 43.5% of US GDP
Source: US Chamber of Commerce. September 2024. https://www.uschamber.com/small-business

Small caps1 are listed companies whose market capitalization is between USD 300mn and USD 2bn in large markets such as the US, although the range limits vary depending on the market. In smaller markets, such as Spain, the upper bound can be lower, often under EUR 1bn.
Above this tier are what are referred to as mid caps, i.e., companies with a market capitalization of between USD 2bn and USD10bn. Large caps are companies whose market capitalization is over USD 10bn.
Small companies make up 90% of the US market and account for 43.5% of US GDP
Source: US Chamber of Commerce. September 2024. https://www.uschamber.com/small-business
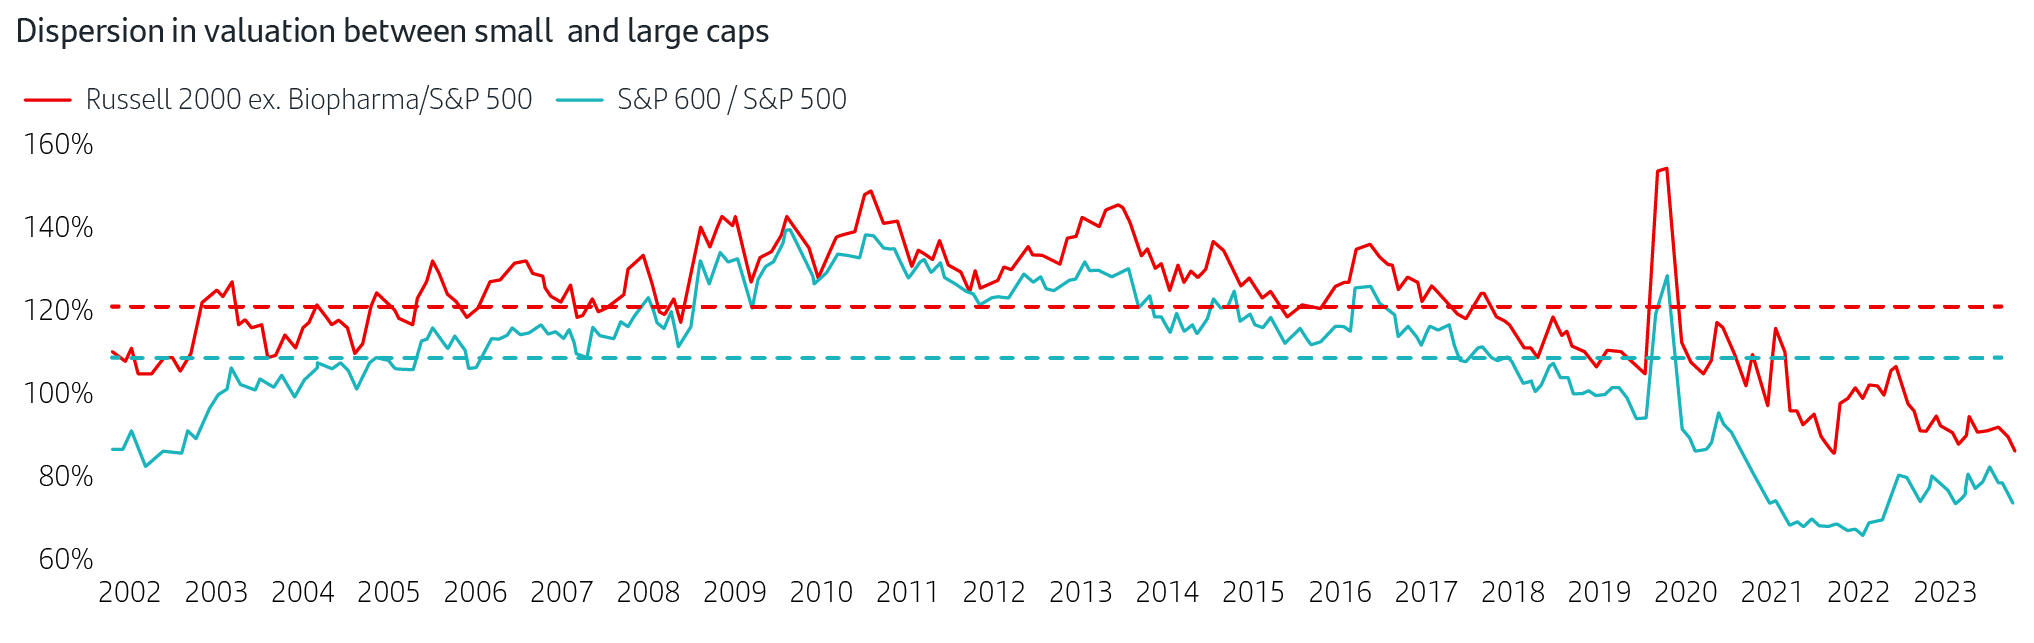
Small caps trade at a significant discount to large caps and with respect to their historical average
Source: American Century Investments. https://www.americancentury.com/insights/should-investors-take-a-closer-look-at-downtrodden-small-cap-stocks/
A significant number of companies in small caps indices are unprofitable
Source: Furey Research Partners. Data as of September 2023
• Small caps account for a large proportion of listed companies. For example, they represent 90% of the US market3.
• Companies in this category are often exposed to market niches or emerging sectors.
• They are often at the forefront of innovation and development within their industries, and many of them are startups.
• Many of them offer exposure to megatrends such as digitalization.
Since they tend to be at an early stage of development, small caps tend to expand faster, which can provide greater appreciation for investors in the long term. Investing in a small cap that is at an early phase of growth can offer the opportunity to share in its success from the outset.
In the past, small cap indexes have tended to appreciate more than large caps: an annualized return since 2004 of +7.7% on the Stoxx Europe Small 200 vs. 5.7% on the Eurostoxx 502.
Not only is the number of index components greater than in the case of large caps (4,100 companies in MSCI World Small Cap vs. 1,500 in MSCI World2), but there is also a greater dispersion of returns than in large cap indices, which offers greater opportunities for generating alpha.
Many of these stocks are not covered by the large research houses. Consequently, it is easier to find companies that are undervalued. Moreover, M&A transactions are more likely in this market segment (approximately twice as likely as among large caps1).
Small caps usually have a lower trading volume. This means it may be harder to buy or sell shares without significantly affecting the price.
They tend to be more volatile in the face of market news or changes in the economy. This volatility means greater risk, but also the possibility of higher returns.
The lower level of coverage and the shortage of information not only represents an opportunity; it also makes it difficult to make investment decisions because investors need to conduct exhaustive research themselves before making investment decisions.
Startups are newly created companies that have a scalable business model and rely on technological innovation to maximise their scope for growth. In contrast, SMEs are small or medium-sized enterprises (in terms of revenue or human capital). Unlike startups, SMEs aren't necessarily new.
Unicorns are companies created in the last 10 years that, without being listed or acquired by a third party, achieve a value of at least USD 1bn.
After underperforming in recent years, small caps are trading at lower multiples and offer a significant discount with respect to large caps. This valuation gap is close to its widest in decades, as small caps are trading around 20% below their historical average1. In addition, small caps are trading at a significant discount compared to their own historical average in most geographies, especially Europe and the USA.
The current context includes reshoring policies and fiscal stimuli that are particularly favourable tosmall caps operating at the domestic level as these policies are designed to strengthen domestic production and reduce dependence on international supply chains.
In addition, according to a survey by William Blair, small companies tend to outperform large companies after periods of economic recession.
The current concentration of large cap indices remains a challenge because it means that the indices are increasingly limited not only to certain companies, but also to certain sectors and factors. According to June data for the S&P 500, market concentration is at a 50-year peak as the six main stocks represent more than 30% of the index's capitalization1. Particularly at this time, investing in small caps offers a significant opportunity for diversification in both absolute (2000 companies in the Russell 2000, where the top 10 represent only 3.62%) and relative (0% overlap with the S&P 500) terms.
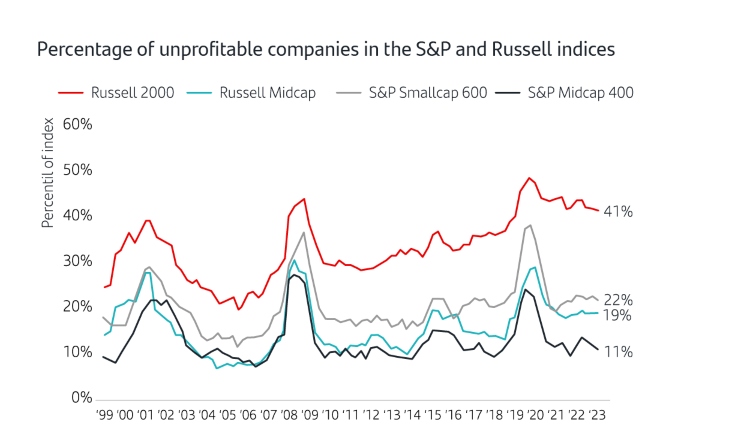
Active management in this segment is important as the quality small caps indices has deteriorated significantly, since a significant number of companies in these indices are not profitable. Currently, more than 40% of the Russell 2000 index and, consequently, of the passive funds and ETFs that track it, consists of companies that are not profitable.


Important Legal Information
This report was prepared by SANTANDER Wealth Management Global Division (“WM”, together with Banco Santander, S.A. and its affiliates shall be hereinafter referred to as “Santander”). This report contains information gathered from several sources and economic forecasts. The information contained in this report may have also been gathered from third parties. All these sources are believed to be reliable, although the accuracy, completeness or update of this information is not guaranteed, either implicitly or explicitly, and is subject to change without notice. Any opinions included in this report may not be considered as irrefutable and could differ or be, in any way, inconsistent or contrary to opinions expressed, either verbally or in writing, advices, or investment decisions taken by other areas of Santander.This report is not intended to be and should not be construed in relation to a specific investment objective. This report is published solely for informational purposes. This report does not constitute an investment advice, an offer or solicitation to purchase or sell assets, services, financial contracts or other type of contracts, or other investment products of any type (collectively, the “Financial Assets”), and should not be relied upon as the sole basis for evaluating or assessing Financial Assets. Likewise, the distribution of this report to a client, or to a third party, should not be regarded as a provision or an offer of investment advisory services. Santander makes no warranty in connection with any market forecasts or opinions, or with the Financial Assets mentioned in this report, including with regard to their current or future performance. The past or present performance of any markets or Financial Assets may not be an indicator of such markets or Financial Assets future performance. The Financial Assets described in this report may not be eligible for sale or distribution in certain jurisdictions or to certain categories or types of investors. Except as otherwise expressly provided for in the legal documents of a specific Financial Assets, the Investment Products are not, and will not be, insured or guaranteed by any governmental entity, including the Federal Deposit Insurance Corporation. They are not an obligation of, or guaranteed by, Santander, and may be subject to investment risks including, but not limited to, market and currency exchange risks, credit risk, issuer and counterparty risk, liquidity risk, and possible loss of the principal invested. In connection with the Financial Assets, investors are recommended to consult their financial, legal, tax and other advisers as such investors deem necessary to determine whether the Financial Assets are suitable based on such investors particular circumstances and financial situation. Santander, their respective directors, officers, attorneys, employees or agents assume no liability of any type for any loss or damage relating to or arising out of the use or reliance of all or any part of this report. Costs incurred for purchasing, holding or selling Financial Assets may reduce returns and are not reflected in this report. At any time, Santander (or employees thereof) may have positions aligned or contrary to what it is stated herein for the Financial Assets, or deal as principal or agent in the relevant Financial Assets or provide advisory or other services to the issuer of relevant Financial Assets or to a company connected with an issuer thereof. This report may not be reproduced in whole or in part, or further distributed, published or referred to in any manner whatsoever to any person, nor may the information or opinions contained therein be referred to without, in each case, the prior written consent of WM. Any third-party material (including logos, and trademarks), whether literary (articles/ studies/ reports, etc. or excerpts thereof) or artistic (photos/graphs/drawings, etc.), included in this report is registered in the name of its respective owner and only reproduced in accordance with honest industry and commercial practices.